How much plastic is too much plastic?
Over the past few years, a large number of studies have been published reporting the presence of microplastics in a wide variety of environments. Plastic has reached remote places like Antarctica is has also been found in our food, directly exposing us to its potential toxic effects. When these studies reach the public, it is often overlooked that plastics, as particulate materials, do not have a single exposure metric. In other words, when we are exposed to a certain amount of a chemical, quantifying exposure in terms of mass (milligrams per litre or per body weight) or in moles (millimoles per litre or per unit of mass) is interchangeable. However, this is not the case for microplastics (nor for nanoplastics, although they have specific characteristics that require separate consideration).
Plastics interact with their environment through their surface, which increases as their size decreases and their shape deviates from a sphere. In particular, a plastic's ability to leach its additives, an important source of exposure to toxic compounds for living organisms, depends on its surface area. If the particle is roughly spherical, its size (measured as average diameter or the diameter of a sphere with the same volume) is directly related to the square root of its surface area. In other geometries, such as fibers, the relationships between size, surface area, and mass are also easy to derive. More information on this can be found in this article. The challenge arises when comparing number concentrations versus mass concentrations.
In an article recently published in Proceedings of the National Academy of Sciences of the United States of America, the authors used a technique called hyperspectral stimulated Raman scattering (SRS) imaging, which, although complex and labour-intensive, is well-suited for the spectral identification of particles smaller than 1 µm. In their study, they applied SRS to bottled water and found particle concentrations of approximately two hundred thousand per litre (2.4 ± 1.3×10⁵), the vast majority of which were smaller than one micron. On the other hand, we conducted a study on the presence of plastic in bottled water samples from major brands in the Spanish market. The results were published in the journal Scientific Reports and showed an average of 0.73 (0.64–1.58) microplastics per litre, which is about three hundred thousand times fewer. And, of course, finding a single plastic particle in a 1.5-litre bottle seems far less concerning than finding 360,000.
The difference, clearly, lies in size. Mass concentration estimates conducted by the University of California group were around 10 ng/L, while our data indicated a mass concentration of 176 ng/L for particles smaller than 100 µm. The median size of the microplastics (< 100 µm) in our samples was 75 µm (calculated as the diameter of a sphere with the same volume as the particle), whereas the particles analysed by the University of California group ranged between 100-200 nm and 1-2 µm. Based on the concentrations measured in our study and considering all particles, not just those < 100 µm, the mass concentration value reached 1.61 (1.10–2.88) µg/L, at which, a person consuming 2 litres of water per day would take approximately 850 years to ingest a single gram of plastic. Although it would certainly be in the form of half a million tiny fragments.
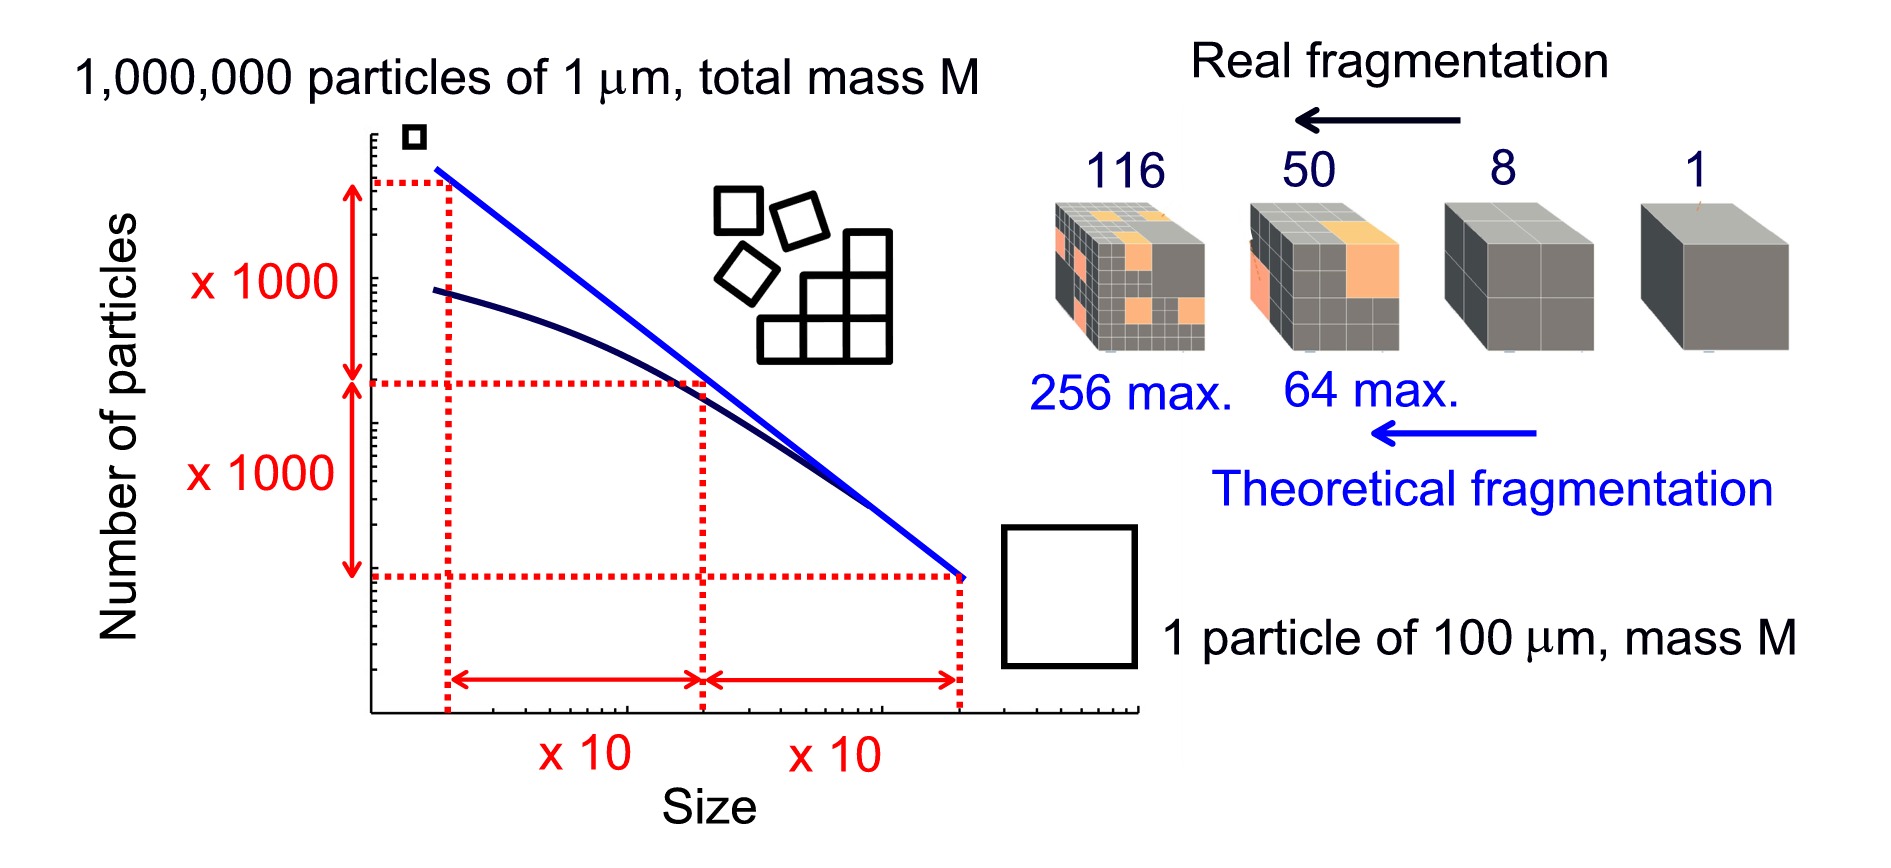
It is well established that small microplastics are produced by the fragmentation of larger ones, except in the case of certain materials specifically manufactured at that size and whose commercialization is subject to increasingly strict regulations. It is also known that fractal fragmentation (fragmentation that maintains self-similar patterns across different scales) conserves mass and if the fractal dimension approaches that of the objects being fragmented (3, in the case of three-dimensional plastics), then the mass distributed between 0 and 10 µm is the same as that between 10 and 20 µm, which in turn is one-tenth of the mass found between 0 and 100 µm. In other words, a 75 µm plastic particle could generate up to 1,000 (10 × 10 × 10) 7.5 µm particles and 1,000,000 750 nm particles, but the total mass would remain unchanged. This is the key to understanding the difference between three hundred thousand plastic particles per litre and one plastic particle per bottle. In both cases, the total plastic mass is not very different, and the discrepancy can be explained by the lower number of small particles produced in real-world fragmentation, as illustrated in the following figure. In fact, the deviation from the power law at small sizes is a well-known phenomenon and was evidenced years ago in studies on the presence of microplastics in the environment.
This interplay between number and mass concentrations is common, delights journalists, and has often (perhaps too often) been used by researchers to emphasize our findings. For example, in a another study, we found that the effluent from a wastewater treatment plant released 10.7 microplastics per litre. When multiplied by the volume of treated wastewater, this amounts to around 300 million microplastics per day from just one of the many treatment plants (there are 150 in Madrid alone) discharging into the Tagus River Basin, which serves approximately 10 million people across Spain and Portugal. One might expect that by the time the Tagus reaches Lisbon, it would be little more than a stream of plastic—yet that is not the case.
The key, as in the previous case, lies in size and mass. If the particle geometry is used to estimate mass concentration, as indicated in a recent article published in Science of the Total Environment, the result was 15 µg/L, equivalent to 430 grams of plastic per day. While this still represents a potentially hazardous pollutant, it no longer seems as alarming, especially considering that the same treatment plant discharged nearly 30,000 tons of treated water per day during the study period.
Another example of creative calculations can be found in atmospheric deposition. In a study, conducted in collaboration with several Spanish research groups, we measured plastic deposition rates using a system of passive samplers like those described in a previous entry. The calculations yielded deposition rates ranging from 5.6 to 78.6 microplastics per square meter per day, with the highest values corresponding to more densely populated areas, particularly Madrid and Barcelona. If we consider a large public square, such as Puerta del Sol in Madrid or Trafalgar Square, both covering approximately 12,000 square meters, the daily deposition rates would be around one million microplastics per day.
As in the previous case, the reason we don't visibly see this much plastic is its size. Based on the geometric measurements of the particles, we have estimated an average mass deposition rate of 50.9 grams per square kilometre per day. When extrapolated to the surface of these squares, this results in an estimated daily deposition of about one gram, roughly equivalent to the weight of a candy wrapper. Of course, this material does not exist as a single piece but is instead broken down into tiny particles, mainly fibers, which are the predominant component of atmospheric plastic. Whether these small fibers or fragments pose a health risk remains a complex question still under investigation, which will be addressed in future publications.