The missing plastic
Plastic is part of our everyday lives because it combines qualities that are very difficult to find in other materials: it is lightweight, durable, inexpensive, and can be used in a huge variety of products. Specifically, because of these advantages, its use has spread so widely that it is hardly an exaggeration to say that we live surrounded by plastic. However, this same expansion has turned plastic waste into a major environmental problem. Continuous production, inadequate end-of-life waste management, and its slow degradation in the environment have led to its accumulation in rivers, soils, and oceans, damaging ecosystems, affecting biodiversity, and even posing risks to human health.
The European Union produces more than 2,200 Mt (million tonnes) of waste every year, of which only around one tenth (about 230 Mt) corresponds to municipal solid waste. Of this amount, only another tenth (32.3 Mt in 2022) consists of plastic waste. This figure contrasts with the nearly two thirds of total waste generated by construction (850 Mt) and mining activities (500 Mt), which, like plastics, largely follow linear models that mostly run from raw material extraction to waste generation, with limited levels of reuse and recycling. Nevertheless, the fact that virtually the entire population generates plastic waste on a daily basis makes its environmental impact particularly visible and difficult to manage. The problem is especially acute in the case of packaging materials, whose use is very short-lived and whose rate of waste generation is very high.
Determining how much plastic we release into the environment is a difficult problem. The OECD, in its 2022 report Global Plastics Outlook: Policy Scenarios to 2060, eestimated a total plastic production of 460 Mt, including fibers and elastomers, of which 428 Mt corresponded to plastics produced from new fossil feedstocks (2019 data). Of this amount, 33 Mt (net, after subtracting losses) would have been recycled. The total amount of plastic waste was estimated at 353 Mt, of which 174 Mt would have gone to landfill, 67 Mt to incineration, and, finally, 79 Mt would have escaped into the environment without control or following inadequate processes such as open burning. The gap between total plastic waste and the 460 Mt produced represented 107 Mt of unaccounted plastic, which, together with the 79 Mt that escaped into the environment, amounted to 40% of total plastic production.
The great diversity of waste management systems worldwide, ranging from highly regulated models to others in which informal practices are widespread, introduces strong differences in the collection, treatment, and final destination of plastics. This heterogeneity hinders comparison and the reliability of figures on the plastic life cycle, as many flows are not recorded in a consistent manner or are directly excluded from official statistics. A clearer picture can be obtained by turning to the data available in the European Union through its official statistics and studies carried out by various organizations and companies, including the detailed reports issued by Plastics Europe, the pan-European association of plastics producers, which represents companies that manufacture more than 90% of polymers in Europe.
In the EU+3 group (EU plus Switzerland, Norway, and the United Kingdom), the production of fossil-based polymers intended for plastics manufacturing reached 43.3 Mt (million tonnes) in 2024. This figure excludes most textile fibers, synthetic rubber, and non-plastic uses such as coatings, paints, and adhesives, and would increase to just over 50 Mt if these were included. The most recent data available (from 2022) indicates that the total amount of plastic waste collected to be reintroduced into the production cycle was 32.3 Mt, out of a net plastic production of 47.2 Mt. These figures refer to waste collected through official schemes, including those to which Spain’s yellow bin (for packaging) belongs. The plastic life cycle can be examined in detail through the use of a material flow diagram. The figure below illustrates this using the data available for 2022, the latest year with reasonably complete public data, drawn largely from the report The Circular Economy for Plastics – A European Analysis, Plastics Europe, 2024.
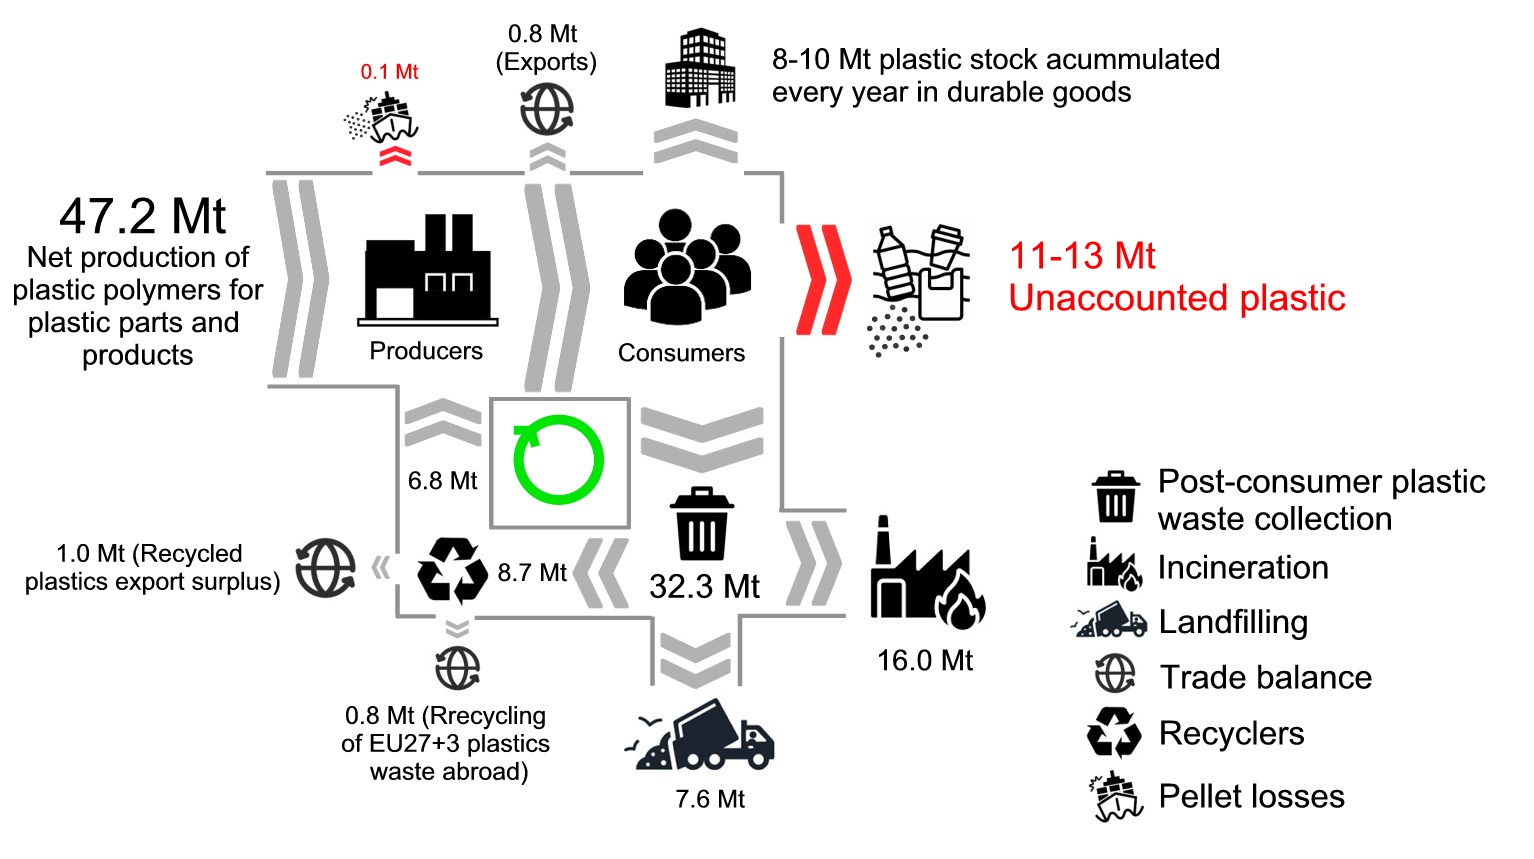
Out of the 32.3 Mt of plastic collected as waste, half (16.0 Mt) is incinerated while a quarter (7.6 Mt) ends up in landfills, though these figures vary widely by country. In Spain, for instance, the proportions are nearly reversed. From the remaining 8.7 Mt, after accounting for processing losses, we must subtract 1.0 Mt of recycled plastic exports and 0.8 Mt of plastic waste that, having been collected and sorted within Europe, was exported to countries outside EU27+3 specifically for the purpose of being recycled. The remaining 6.8 Mt, almost all of which comes from mechanical recycling, flows back into the production process (indicated by the green arrow). A slight export surplus completes the balance, calculated as the difference between the EU-27+3’s plastic conversion and consumption by end-users. This calculation may raise some doubts; however, in any case, it represents a small percentage of total production.
A balance of plastic flows reveals that 21 Mt of plastic have gone missing. It has been suggested that a portion of this is held within the economy’s 'plastic stock' in the form of durable goods. Clearly, in a steady-state system, this accumulation would be zero. However, given the long lifespan of certain materials, such as those used in construction, and the rapid surge in plastic demand until the turn of the century, it is expected that the economy is still accumulating plastic. Since the 1950s, the European economy has used about 2,000 Mt of plastic, of which more than a quarter might still be in use. According to a model developed by Material Economics Sverige AB (now part of McKinsey & Company), the volume of plastic currently embedded in the European economy stands at 550 Mt and continues to grow at a rate of 8-10 Mt per year. This time lag is not only due to the existence of long-lived goods but also to the shifting ways plastic is used. Modern durable products, such as cars, contain significantly more plastic than older models, a fact that accounts for part of the 21 Mt in 'missing' plastic previously calculated. Of course, this accumulation cannot continue indefinitely. Sooner or later, all plastic used will end up incinerated, in landfills, or scattered into the environment as unmanaged waste or fragments from the wear and tear of items like synthetic textiles and tires.
Assuming the estimate of 8-10 Mt of plastic per year sequestered in durable goods is accurate, there are still 11-13 Mt unaccounted for in Europe’s plastic balance. This discrepancy has already been highlighted in other studies. In 2022, the international consultancy SYSTEMIQ published a report Reshaping plastics: Pathways to a circular, climate neutral plastics system in Europe. They calculated that in 2019, out of a total demand of 50.7 Mt, only 29.1 Mt could be collected as waste. The authors attributed half of that difference to accumulation in durable consumer goods, leaving 10.8 Mt that likely ended their life cycle as unmanaged waste, a figure consistent with the calculation detailed above.
The plastic missing from these balances is hard to explain unless we assume it is the very same material detected across the environment during waste and microplastic sampling. This is the plastic that wastewater treatment plants fail to capture; the waste that rainfall washes into our rivers when combined sewer systems overflow; the synthetic fibers found in atmospheric fallout; and the particles released through vehicle tire wear.
The obvious question is whether it is possible to stop this continuous flow of plastic into the environment. The short answer is that it is impossible to reduce the impact of any human activity to zero. What is possible, however, is to keep that impact within acceptable limits. Another bad news is that this cannot be achieved without substantial changes to how we use and manage plastic. This will be the subject of a future blog post.